Bitcoin (BTCUSD) is down 1.18% at Sep 10 08:35(ET), now at $77371.25, with a 7-day down of 5.00%.
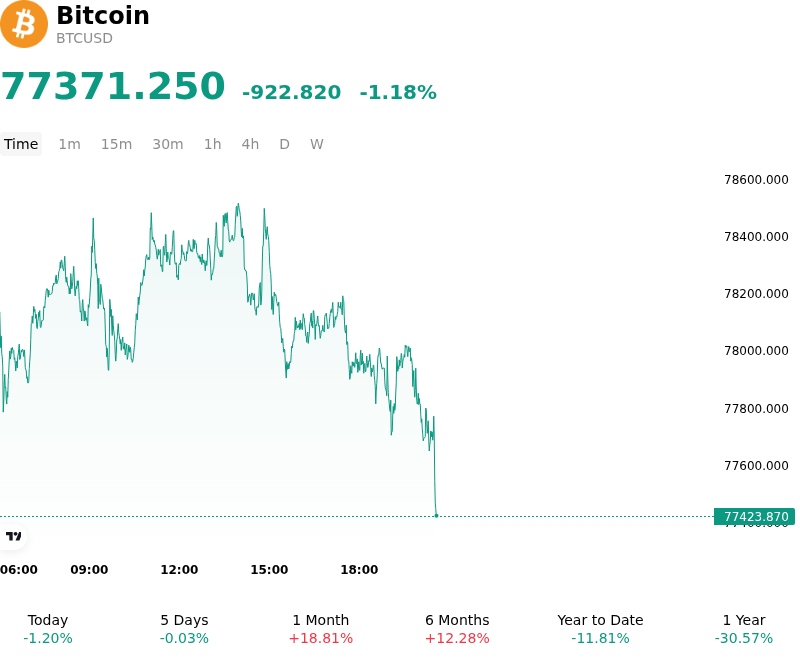
What is driving Bitcoin (BTCUSD)’s stock price down today?
Bitcoin experienced downside pressure as rising long-end U.S. Treasury yields and tightening macroeconomic conditions weighed on broader risk appetite. Benchmark U.S. 10-year Treasury yields surged above multi-month highs, driven by lingering inflation concerns, elevated sovereign debt supply, and rising energy prices. The upward re-rating of risk-free yields increased the opportunity cost of holding non-yielding digital assets, dampening institutional demand and prompting investors to scale back risk exposure across speculative asset classes.
Institutional liquidity flows reflected this macroeconomic caution, as U.S. spot Bitcoin ETFs registered net daily outflows following a period of strong sustained accumulation. The temporary pause in net institutional inflows reduced spot market absorption, leaving price action more vulnerable to overhead selling pressure. Market participants actively de-risked portfolios ahead of critical U.S. consumer price index releases and upcoming Federal Reserve monetary policy deliberations, opting for defensive positioning until monetary clarity improves.
From an on-chain and technical perspective, Bitcoin faced substantial resistance near its overhead cost-basis supply wall. On-chain data indicates a heavy concentration of investor cost bases situated just above recent trading levels, creating persistent profit-taking and breakeven selling from recent entrants. In derivatives markets, the minor price decline triggered localized long liquidations on key leverage exchanges, amplifying short-term downside momentum as speculative leverage was unwound.
Despite intraday volatility, key structural indicators indicate that long-term holder distribution remains relatively disciplined, keeping prices anchored above primary market mean support levels. Institutional asset managers view current market behavior as a liquidity-driven consolidation within a broader macro range, rather than a fundamental regime shift. Near-term market direction will depend on macroeconomic inflation trajectory, real yield movements, and the resumption of net positive ETF capital flows.
Technical Analysis of Bitcoin (BTCUSD)
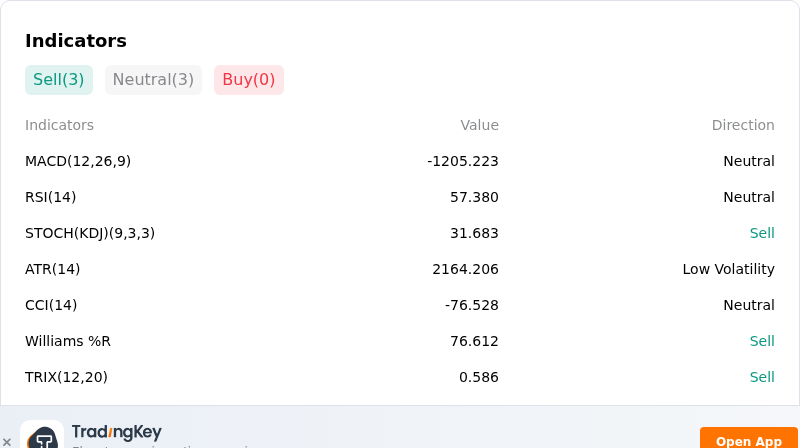
Technically, Bitcoin (BTCUSD) shows a MACD (12,26,9) value of -1205.223, indicating a neutral signal. The RSI at 57.380 suggests neutral condition and the Williams %R at 76.612 suggests sell condition. Please monitor closely.
More details about Bitcoin (BTCUSD)
Recent Events and Risks:
- Institutional Spot ETF Outflows: U.S. spot Bitcoin ETFs recorded consecutive net daily outflows exceeding $166 million over recent trading sessions, driven by redemptions across major funds like ARKB, GBTC, and FBTC, signaling a sharp slowdown in institutional buying pressure.
- Derivatives Long Liquidation Cascade: Heightened market volatility triggered the forced closure of nearly $270 million in long Bitcoin futures positions in a single day, amplifying downside momentum and putting critical technical support in the $76,000–$77,000 range under severe stress.
- Hawkish Fed Interest Rate Expectations: Stronger-than-anticipated economic data and sticky price pressures pushed market-implied odds of a Federal Reserve interest rate hike above 60%, driving Treasury yields higher and reducing risk appetite for speculative digital assets.
- Geopolitical Oil Price Shock and Risk-Off Sentiment: Escalating geopolitical tensions between the U.S. and Iran near the Strait of Hormuz propelled crude oil prices above $100 per barrel, intensifying global inflation fears and triggering a broader cross-asset sell-off that weighs on BTC.
Find out more