Sugar (SUGAR) is up 2.05% at Sep 10 06:15(ET), now at $0.1942, with a 7-day up of 4.35%.
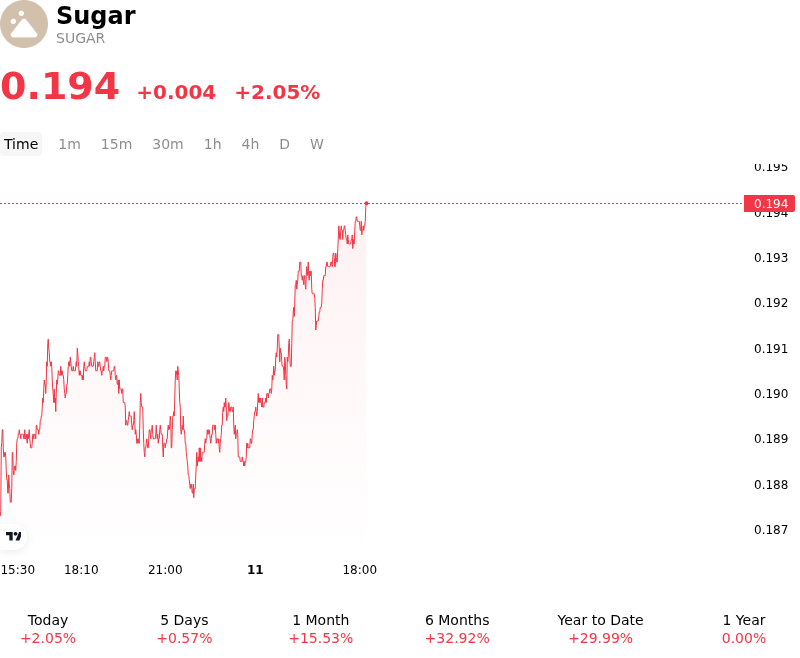
What is driving Sugar (SUGAR)’s stock price up today?
Raw sugar futures advanced as a sharp escalation in energy prices coincided with deteriorating production outlooks across major global suppliers. A key catalyst behind the upward movement was a significant rally in global crude oil prices, which surged to multi-month highs. Higher oil prices strengthened ethanol profitability, prompting sugarcane mills in Brazil's Center-South region to alter their crushing mix in favor of biofuel production over raw sugar processing. This ethanol parity pull effectively restricted exportable sugar supply from the world's top producer at a time when global inventories are already facing structural pressure.
Compounding the energy-driven supply diversion, market expectations were further tightened by major crop downgrades in key Asian and European producing regions. The Thai Sugar Millers Corporation projected a substantial year-over-year drop in Thailand's upcoming harvest due to persistent drought and unfavorable weather patterns associated with El Niño, severely limiting supply prospects from the world's second-largest exporter. Simultaneously, hot and dry summer weather across Europe cut sugar beet yield expectations, driving forecasts for European Union production substantially lower. These cumulative weather-related output revisions led major forecasting bodies, including the International Sugar Organization, to flip their global sugar market balance projections from a previously expected surplus into a deficit.
Demand dynamics and institutional positioning provided additional momentum to the price advance. India's policy measures to stabilize domestic retail prices through duty-free raw sugar import quotas continued to underpin trade demand, signaling that one of the world's largest consumers remains an active buyer on international spot markets. In response to tightening global balance sheets, institutional investors expanded net-long positioning in sugar futures to multi-year highs. While high physical prices may trigger temporary profit-taking or demand rationing among bulk buyers, the broader market trajectory reflects a fundamental shift toward structural deficit, keeping prices sensitive to further supply shocks and energy market developments.
Technical Analysis of Sugar (SUGAR)
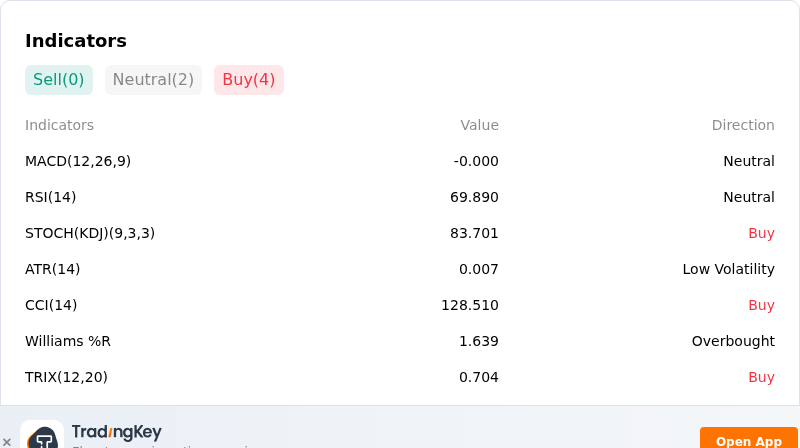
Technically, Sugar (SUGAR) shows a MACD (12,26,9) value of -0.000, indicating a neutral signal. The RSI at 69.890 suggests neutral condition and the Williams %R at 1.639 suggests overbought condition. Please monitor closely.
More details about Sugar (SUGAR)
Recent Events and Risks:
- Accelerated Brazilian Crushing and Sugar Mix: UNICA output data indicates Center-South Brazilian mills are raising the allocation of sugarcane crushed for sugar to over 53–55%, accelerating harvest pace and boosting bi-weekly sugar output, which increases near-term export availability and pressures futures.
- Indian Government Stock Holding Restrictions: New Delhi lowered domestic sugar dealer stock-holding limits from 400 MT to 200 MT to release private inventories into local market channels, dampening expectations for immediate physical import demand from India.
- Extreme Speculative Positioning and Liquidation Vulnerability: Commitment of Traders reports show fund net-long positions in ICE raw sugar futures at multi-year highs of over 132,000 contracts, exposing the market to sharp downside volatility from forced profit-taking or systematic long liquidations.
- Potential Indian Bumper Crop and Export Quotas: Improved seasonal monsoon rainfall across key growing belts has boosted domestic production forecasts, sparking market speculation that India may permit export quotas in the upcoming trade season, threatening to release substantial global supply.
Find out more